Assessing Student Graphing Skills: A Comprehensive Guide for Educators
Graphs (as well as charts, plots, and maps) are essential tools for exploring and communicating with data. However, creating, analyzing, and interpreting them requires a unique set of skills. Therefore, assessing students' graphing abilities is key to identifying gaps in understanding and fostering overall data literacy. A well-constructed rubric can provide structure and clarity, ensuring that students not only learn how to create graphs but also understand their purpose and application.
This guide will explore how to assess student graphing skills effectively. From understanding the key components of a graphing rubric to tips for avoiding common pitfalls, this comprehensive resource will equip you with strategies to evaluate and improve your students’ graph literacy (a component of data literacy). By the end of this guide, you’ll have actionable insights to help your students master graphing while building critical thinking and analytical skills.
Looking for ready-to-use resources? Check out our Graph Components of a Rubric for practical tools to assess student skills!
Why Assessing Graphing Skills Matters
Graph literacy is a foundational skill that extends across disciplines—from math and science to social studies and beyond…aka any place we use visual representations of data. Assessing students’ graphing skills helps us educators to better:
- Identify which areas our students are struggling (e.g., choosing appropriate graph types, selecting relevant data, scaling axes).
- Foster critical thinking by teaching students how to actively be in the driver seat as they make their graphs (charts, plots, maps, etc.).
- Prepare students for real-world situations in which making sense of data visualization is essential.
Some examples of real-world applications that students may encounter that require strong graph literacy include things like:
- Cross-Curricular Benefits: Understanding graphs enhances performance in subjects like history (e.g., population trends) or economics (e.g., market analysis) as well as are increasingly key aspects of math and science state summative assessments.
- STEM Careers: Scientists, engineers, and analysts rely on graphs to communicate research findings.
3. Everyday Decision-Making: From understanding election polls to analyzing personal finances to reading your electricity bills, graphs are everywhere.
Components of an Effective Graphing Rubric
A well-designed rubric is an essential tool for assessing student graphing skills. It provides clear criteria for evaluation and helps students understand what is expected of them.
When Should We Use a Graphing Rubric
One thing to remember is that the best place to use such a graphing rubric is after students have had time to fully interpret the data and time to create their graph to communicate a conclusion or explanation from the data. Aka, we do not want to be assessing students graphing abilities as they are actively exploring the data to do initial data analysis. All of our data visualizations are tools we use to communicate stories from the data, but there needs to be a story to tell in order to put together the visualization.
If we assess students as they are building graphs to make sense of the data, that would be like assessing students' abilities to write a story as they are brainstorming their ideas.
Key Components of a Graphing Rubric
Here are the four key components to include in a graphing rubric, listed in the order of importance as it relates to understanding students abilities to construct graphs:
1. Graph Type Selection
- Does the chosen graph type match the types of data and purpose?
- Is the graph type used effectively to communicate information?
2. Accuracy of Data Representation
- Are the data points plotted correctly?
- Does the graph title communicate the claim or storyline from the data (aka not retelling what variables are plotted on the graph)?
3. Clarity of Construction
- Are all axes and legends labeled, easy to read, and include corresponding units?
- If applicable, are axes scaled consistently and appropriately for the data?
4. Aesthetics of Visualization
- Is the overall design clean and free from clutter?
- Are the lines straight (if relevant) and word legible?
Sample Rubric Criteria
These four components can be used across any set up of rubrics you are using. Here are two examples of setting up the above components in an Analytic and a Single-Point format.
Analytic Rubric Example - Here is an example of setting up the “Graph Type Selection” component in an analytic style to communicate to students where they are in terms of mastery of graph choice.
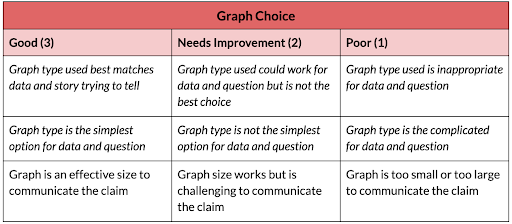
Single-Point Rubric Example - Here is an example of setting up the “Graph Type Selection” component in a single-point style to share both strengths and areas to focus future work as it relates to the graph type that students selected.

Download our free Graph Rubric Guide to start assessing your students today!
Strategies for Assessing Student Graphing Skills
Having a working rubric is an important part of consistently assessing students’ skills, but just as important is having ideas of what kinds of educational experiences lend themselves well to assessing students’ skill abilities.
Here are some suggestions of ways to expand those educational experiences beyond worksheets, digital notebooks, and/or homework assignments.
1. Expand Hands-On Activities
Hands-on activities are a cornerstone of all of our teaching. Opening up these activities to allow students to demonstrate their graphing skills in a wider variety of real-world contexts and/or with a wider range of materials can be illuminating of their graphing skills.
For example, if you are having students collect daily temperature data as part of your Weather & Climate unit, invite students to:
- Create a graph to represent their findings on paper as well as using provided manipulatives (e.g., beads, beans, legos).
- Create two graphs of the same dataset to communicate two different stories from the daily temperature data.
2. Incorporate Peer Review
Peer review encourages collaboration while helping students refine their skills. It is also a key aspect of building out how students think about assessment, and can make things easier for you (a win-win in our books :)).
Where to get started? What about asking students to exchange their graphs with peers, who evaluate them using a simplified version of your rubric. Students should complete the rubric for their classmates and then discuss with each other outstanding questions they have with one another.
This process reinforces rubric criteria while providing valuable feedback for the students building the graph. This can be used once students are finished making their graph, or as a formative set as they are working to finalize their graph.
3. Leverage Cross-Discipline Opportunities
Students work with data across multiple subjects in K-12 – math, science, social studies, computer science, etc. Therefore, coordinating with your colleagues what you asking students to create in their graphs across these different subject areas can make your, and your students’, lives much easier. Consider working together to align on your graphing rubrics so that students are being asked to construct similar kinds of graphs (charts, plots, maps) across our classes.
Common Pitfalls in Assessing Graphs (and How to Avoid Them)
Even with a strong rubric, there are common pitfalls educators should avoid when assessing student graphs:
1. Overemphasizing Design Over Content
- Problem: Focusing too much on aesthetics rather than graph selection, accuracy, and/or construction of the visualization. If we lean too hard into the aesthetics (e.g., labels, colors, tick sizes) we reinforce that how it looks is more important than what a graph includes.
- Solution: Ensure your rubric prioritizes the first three key components of a graphing rubric.
2. Neglecting Context
- Problem: Assessments that don’t consider whether the chosen graph type fits the dataset. We use graphs (charts, plots, maps) as a tool to tell a story or share a finding from the data. This is always grounded in our question of what we are trying to ask of the data. That purpose is critical for constructing the graph, we cannot leave this out of our rubrics.
- Solution: Include criteria in your rubric that evaluate whether the graph type is appropriate.
3. Inconsistent Scoring
- Problem: Subjectivity in scoring can lead to inconsistent evaluations. Making a graph (chart, plot, map) seems so easy on the surface. But there are thousands of books devoted to doing it well (check out https://www.dataspire.org/book-suggestions for some suggestions we have :)) and people’s entire jobs are devoted to learning how we can do it better. So much goes into making a graph…so we need to set students up for success by being consistent in how we give them feedback on their graphs.
- Solution: Use detailed descriptors in your rubric to ensure consistency both among students and across different assignments.
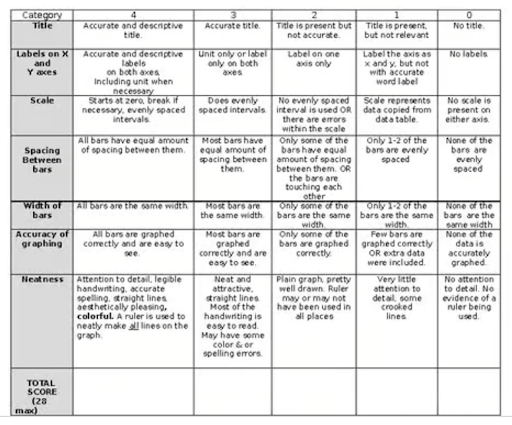
For example the Bar Graph Rubric shared by Science Science Science on Teachers Pay Teachers focuses entirely on Components #3: Clarity of Construction and #4: Aesthetics of Visualization only. This is an Analytic rubric with many details, but it does not include the key components #1: Graph Type Selection and #2: Accuracy of Data Representation.
Explore more resources on assessing student skills today!
Conclusion: Empower Your Students Through Assessment
Assessing student graphing skills is about more than just grading—it’s about fostering critical thinking, creative reasoning, and data literacy. By using rubrics effectively within and across educational activities, we can help your students become confident creators and interpreters of graphs.
Start implementing these strategies today by downloading our free resources or exploring more tools on our website!
Ready to take your assessments further? Visit our Graphs Components of a Rubric page or explore our Digital Resources now!
